最新消息 活動預告
3月 2021
(星期三)
How to Improve Data Efficiency One Hundred Times with a Low-Cost Solution (24 Mar 21)
- 相關學科
- 金融科技
感謝各位熱烈參與!
以上活動經已圓滿結束,敬請密切留意學院稍後活動。
活動重温
- 日期及時間
- 2021年3月24日 (星期三)18:30 - 19:15
- 地點
- Zoom Webinar
- 費用
- 免費
Mr Danny W. C. Chan
Mr. W. C. Chan, FRM, has possessed rich experience in financial risk management, information technology and data science and worked as IT Manager over a decade. Being a practitioner in information technology, he is currently a consultant and trainer at Big Data Consultancy Services Company. Also, he is strong in Cloud-based solutions, Big Data Technology, Data Mining and Machine Learning. Moreover, Mr. Chan has obtained a Bachelor Degree in Mathematics from The Chinese University of Hong Kong as well as three Master Degrees in Risk Management Science from The Chinese University of Hong Kong, Quantitative Analysis for Business from City University of Hong Kong and Industrial Logistics Systems from The Hong Kong Polytechnic University.
- 查詢
- 2867 8331 (finedec@hkuspace.hku.hk)
- 相關課程
- 更多相關課程
- 備註
Language: Cantonese (Supplemented with English)
Is your company holding a large volume of data but your management is wondering how to make use of it to boost the business?
Are your accounting team members doing monthly financial and management reports manually in an inefficient manner and you are looking for a solution to reduce and automate the reports?
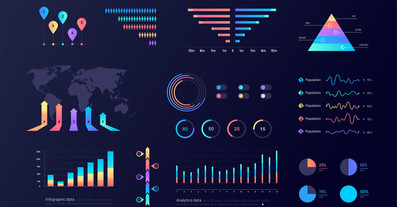
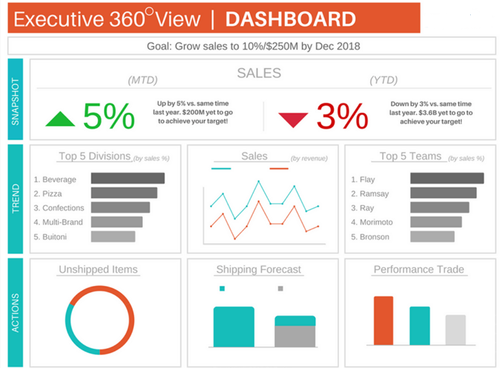
Some people would think about BI solutions with data visualization techniques and may come up with a typical design of management dashboard like the one shown below. Some of them would assess whether they should develop the dashboard with Tableau or Power BI.
Our honourable speaker, Mr Danny W. C. Chan, who is a lecturer of the Executive Certificate in Interpretation and Visualization of Business Big Data, would like to share his professional experience in Data Visualization with you.
By reviewing the above design, Mr Chan would like to ask you:
1. What deficiencies the above design suffers from?
2. How to improve the design to replace hundreds of reports with a dashboard?
3. How to prepare, transform and consolidate the data into a dashboard?
4. How to incorporate top-down and drill down design into a dashboard?
Mr Chan will give you a convincing answer during his coming webinar. Moreover, Mr Chan will give you a definitive guideline to choose between Tableau and Power BI. He will also present a common business use case starting from preparing data with Excel to transforming, consolidating and eventually visualizing the data with a management dashboard. The data pipeline is run from start to end and Mr Chan will demonstrate how we can efficiently leverage the high value of data with automation. This is a not-to-be-missed opportunity to take a look at the full process in a single showcase.
Without exaggeration, you will see that the presented solution is 100 times more efficient than how an average office member is doing!
It is worth mentioning that there is virtually no programming, no VBA, no Macro and no even Excel formulas behind the solution as Mr Chan advocates developing data solutions in an unimaginably simple approach.
Please enrol the webinar and you will find it is much worthwhile watching the showcase from Mr Danny Chan.
If you are new to the concept of “Data Visualization”, please watch the video: https://www.wevideo.com/view/2037621150
Remark: Most of the data visualization techniques illustrated in the above video will be covered in the programme of “Executive Certificate in Interpretation and Visualization of Business Big Data”.


